
EXPLORATORY DATA ANALYSIS
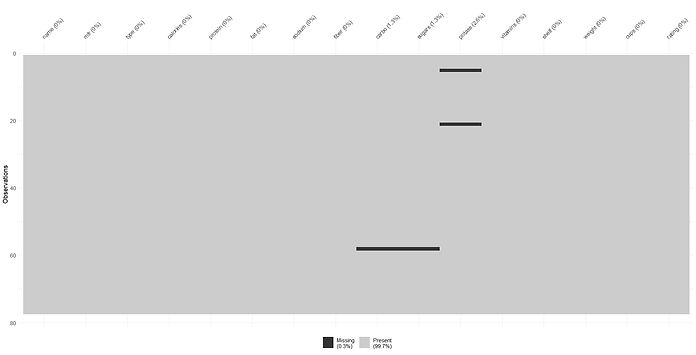
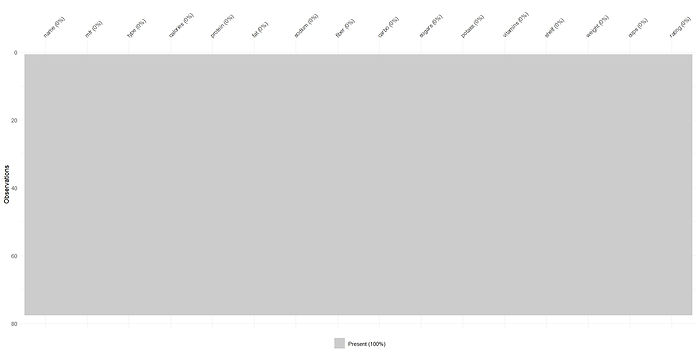
Firstly, visualization of missing values in the data is done. It shows there are 4 missing values in total. kNN (k-nearest neighbors) method is used to impute these missing values. The same visualization is done again in order to confirm there are no more missing values in the data. Both of the visualizations are shown below respectively.
Basic statistical analysis of the data is then performed. Data Manipulation is done accordingly too as required. For uniformity of data, sodium and potassium are converted from milligrams to grams, so that the scales match while plotting the nutrients data.
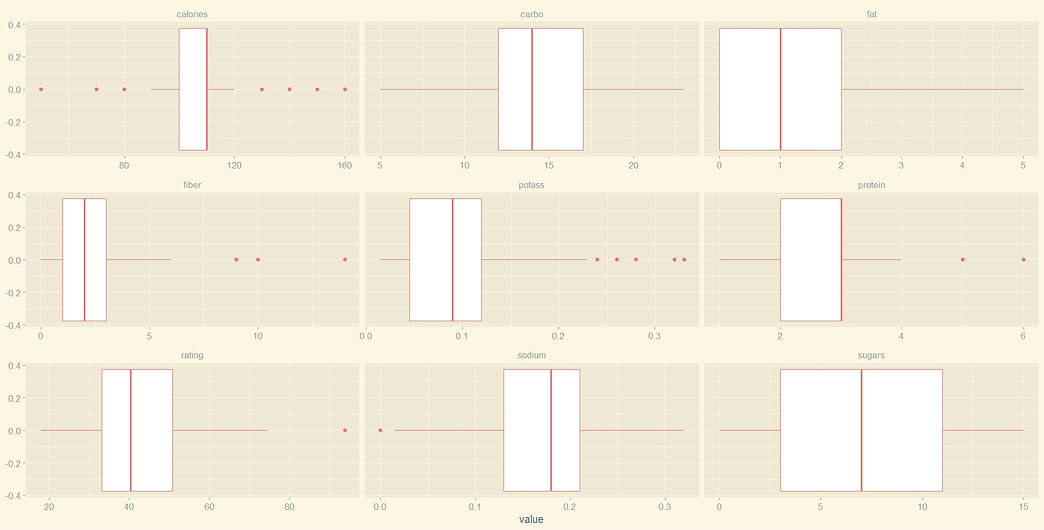
Visualization of calories, nutrients, and ratings are done all together at once by plotting their individual box plots.
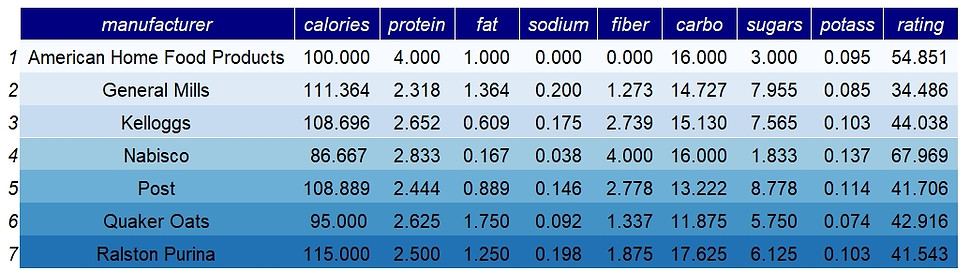
Then to see the comparison among calories, nutrients, and ratings across different manufacturers, a table of their aggregate means for each manufacturer is plotted.
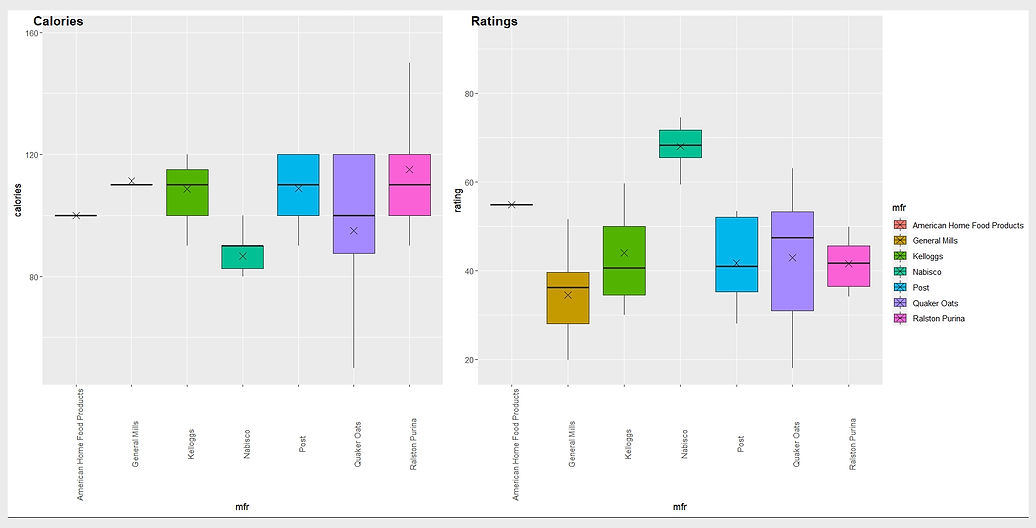
To further understand this distribution, box plots of calories and ratings against manufacturers are plotted respectively.
Now, density plots of calories, nutrients and ratings across different manufacturers are plotted respectively.

Finally, in order to check the relation among calories, nutrients and ratings, a correlation matrix of them is plotted.

As inferred from the earlier plots, we can see that calories and ratings are negatively correlated, i.e., they have no relation between them. We can also see that calories and certain/most nutrients are positively correlated, especially calories has high correlation with fat and sugars. Nutrients and ratings are both positively and negatively correlated.